K8S Event事件内容分析.md
一、概述
k8s的Event事件是一种资源对象,用于展示集群内发生的情况,k8s系统中的各个组件会将运行时发生的各种事件上报给apiserver 。可以通过kubectl get event 或 kubectl describe pod podName 命令显示事件,查看k8s集群中发生了哪些事件。
apiserver 会将Event事件存在etcd集群中,为避免磁盘空间被填满,故强制执行保留策略:在最后一次的事件发生后,删除1小时之前发生的事件。
二、event信息的查看
在K8S集群的master节点上运行
kubectl get event -n project-1573显示内容如下
LAST SEEN   TYPE      REASON              OBJECT                                MESSAGE
10m         Normal    SuccessfulRescale   horizontalpodautoscaler/hpa-10143     New size: 12; reason: cpu resource utilization (percentage of request) above target
10m         Normal    Scheduled           pod/service-10143-54fc6ff487-qwlds    Successfully assigned project-1573/service-10143-54fc6ff487-qwlds to 10-192-2-23.mars.ipcpu.com
10m         Normal    Pulling             pod/service-10143-54fc6ff487-qwlds    Pulling image "reg.ipcpu.com/push/push-jms-consumer:prod-1.0-SNAPSHOT-1321"
10m         Normal    Pulled              pod/service-10143-54fc6ff487-qwlds    Successfully pulled image "reg.ipcpu.com/push/push-jms-consumer:prod-1.0-SNAPSHOT-1321"
10m         Normal    Created             pod/service-10143-54fc6ff487-qwlds    Created container service-10143
10m         Normal    Started             pod/service-10143-54fc6ff487-qwlds    Started container service-10143
9m3s        Warning   Unhealthy           pod/service-10143-54fc6ff487-qwlds    Readiness probe failed: Get http://10.193.49.247:9203/actuator/health: dial tcp 10.193.49.247:9203: connect: connection refused
10m         Normal    SuccessfulCreate    replicaset/service-10143-54fc6ff487   Created pod: service-10143-54fc6ff487-xk5zn
10m         Normal    ScalingReplicaSet   deployment/service-10143              Scaled up replica set service-10143-54fc6ff487 to 12
第一列是发生时间,第二列是类型有Normal、Warning类型,第三列是Reason,是一个简单词组,第四列是实例的ID信息,第五列是详细信息。
如果觉着上述信息不够全面,还可以使用ymal格式查看执行
kubectl get event -n project-1573 -o yaml内容格式如下:
- apiVersion: v1
  count: 34
  eventTime: null
  firstTimestamp: "2021-05-26T16:40:14Z"
  involvedObject:
    apiVersion: v1
    fieldPath: spec.containers{service-16382}
    kind: Pod
    name: service-16382-5875dbbf9b-q8lm7
    namespace: project-1573
    resourceVersion: "264300624"
    uid: 56e46978-a68f-483a-ace2-8489a49d74be
  kind: Event
  lastTimestamp: "2021-06-01T06:16:24Z"
  message: 'Liveness probe failed: Get http://10.193.8.143:5000/actuator/health: net/http:
    request canceled (Client.Timeout exceeded while awaiting headers)'
  metadata:
    creationTimestamp: "2021-06-01T06:16:24Z"
    name: service-16382-5875dbbf9b-q8lm7.16f2b52c43b0c499
    namespace: project-1573
    resourceVersion: "266833717"
    selfLink: /api/v1/namespaces/project-1573/events/service-16382-5875dbbf9b-q8lm7.16f2b52c43b0c499
    uid: 18704234-943b-43bf-8738-4ce8185402f1
  reason: Unhealthy
  reportingComponent: ""
  reportingInstance: ""
  source:
    component: kubelet
    host: 10-192-2-21.mars.ipcpu.com
  type: Warning
kind: List
metadata:
  resourceVersion: ""
  selfLink: ""
三、event信息的分类
我们收集了线上集群的数据,主要以下几种,
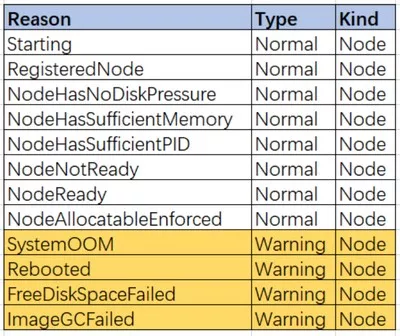
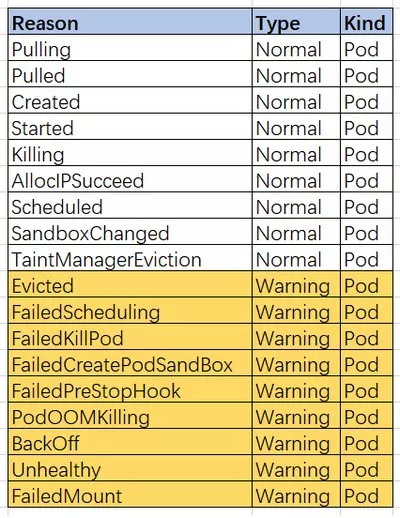
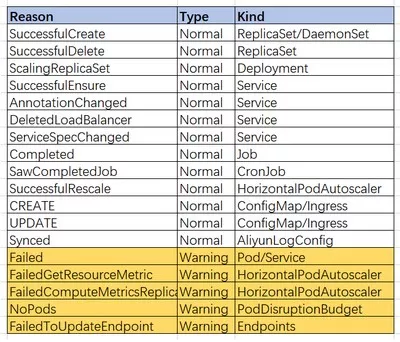
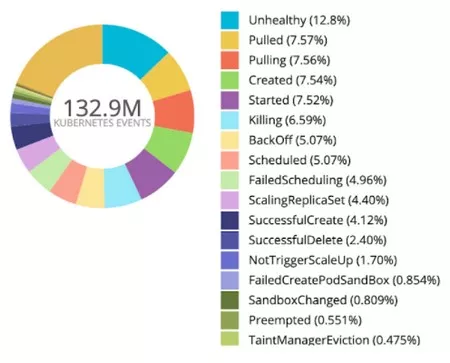
我们根据Reason做了一个饼图,如下
四、Event的报警
在实现报警之前,最好将Event信息远程存储到集中的ES或者是阿里云日志服务SLS。
这样我们就可以进行集中的查询分析。
使用kubernetes-event-exporter组件可以实现,这里就不谈详细的方法了。
以阿里云日志服务SLS为例,我们的报警查询语句如下:
eventId.type: Warning | select "eventId.reason", "eventId.involvedObject.kind", "eventId.involvedObject.namespace", "eventId.metadata.name", "eventId.message", "eventId.count" from log经过一段长时间的运行,我们发现里面有坑,如果HPA导致Pod释放,但是Pod的健康检查仍然存在,就会报一些UnHealthy报警,但是当你登录系统查看时,发现Pod刚刚被删除。
所以后来我们把 eventId.reason : Killing 也一并设置了查询条件,由报警系统进行逻辑判断,如果收到了Pod的Killing报警,那么就不在处理相关Pod的UnHealthy报警。
参考资料
https://segmentfault.com/a/1190000041204565
https://www.cnblogs.com/zhangmingcheng/p/15917333.html
转载请注明:IPCPU-网络之路 » K8S Event事件内容分析和告警