Flume进阶Interceptor和监控.md
一、Flume的Interceptor
Flume中的拦截器(interceptor),用户Source读取events发送到Sink的时候,在events header中加入一些有用的信息,或者对events的内容进行过滤,完成初步的数据清洗。
使用拦截器Interceptor之前先要了解Flume中事件(event)的结构:
event是flume传输的最小对象,从source获取数据后会先封装成event,然后将event发送到channel,sink从channel拿event消费。
event由头部(Map
Flume的拦截器Interceptor可以在event放到channel之前插入一些header,比如HDFS Sink用到的timestamp,也可以对body内容进行修改或者根据内容过滤。
Flume-NG自带拦截器有多种,常用的有如下:
Timestamp Interceptor, 可以往event的header中插入关键词为timestamp的时间戳。
Host Interceptor, 该拦截器可以往event的header中插入关键词默认为host主机名或者ip地址
Static Interceptor,增加一个static的header并为所有的事件赋值。范围是所有事件。
Search and Replace Interceptor,按照java正则表达式,对event内容进行查找和替换
Regex FilteringInterceptor,该拦截器用于过滤事件,筛选出与配置的正则表达式相匹配的事件。可以用于包含事件和排除事件。常用于数据清洗,通过正则表达式把数据过滤出来。
接下来我们用一个例子来演示Timestamp Interceptor和Host Interceptor
a1.sources.r1.interceptors = i1 i2
a1.sources.r1.interceptors.i1.preserveExisting= false
a1.sources.r1.interceptors.i1.type =timestamp
a1.sources.r1.interceptors.i2.type = host
a1.sources.r1.interceptors.i2.hostHeader =hostname
a1.sources.r1.interceptors.i2.useIP = true
最终效果如下,
2018-02-06 18:50:54,818 (SinkRunner-PollingRunner-DefaultSinkProcessor) [INFO - org.apache.flume.sink.LoggerSink.process(LoggerSink.java:95)] Event: { headers:{hostname=10.140.12.12, timestamp=1517914254814} body: 69 61 6D 73 74 72 69 6E 67 0D iamstring. }我们看到header中增加了2个字段hostname和timestamp。
接下来我们看一个正则过滤(Regex FilteringInterceptor)的例子:
# Describe/configure the source
a1.sources.r1.type = syslogtcp
a1.sources.r1.port = 50000
a1.sources.r1.host = 192.168.233.128
a1.sources.r1.channels = c1
a1.sources.r1.interceptors = i1
a1.sources.r1.interceptors.i1.type =regex_filter
a1.sources.r1.interceptors.i1.regex =^[0-9]*$
a1.sources.r1.interceptors.i1.excludeEvents =true
#@过滤掉(删除)所有数字开头的数据
再来看两个替换的例子(Search and Replace Interceptor)
a1.sources.r1.interceptors = search-replace
a1.sources.r1.interceptors.search-replace.type = search_replace
a1.sources.r1.interceptors.search-replace.searchPattern = actionType
a1.sources.r1.interceptors.search-replace.replaceString = AT
#@效果是替换event内容中的actionType为AT
a1.sources.r1.interceptors = search-replace
a1.sources.r1.interceptors.search-replace.type = search_replace
a1.sources.r1.interceptors.search-replace.searchPattern = \"actionType\"
a1.sources.r1.interceptors.search-replace.replaceString = "programid":0,"actionType"
#@效果是在actionType前面加上一些数据
二、Flume的监控
Flume本身内置了一些监控接口,主要有如下几个
JMX Reporting,提供JMX接口的监控数据
Ganglia Reporting,将监控数据发送到Ganglia
JSON Reporting,提供HTTP接口的json格式监控数据
我们平时最常用的就是第三个JSON格式的监控数据,先看下如何开启
nohup bin/flume-ng agent -c conf --conf-file conf/flume.conf --name a1 -Dflume.root.logger=INFO,console -Dflume.monitoring.type=http -Dflume.monitoring.port=34545 只需要在启动参数加上后面2个参数就可以,flume会在34545启动一个HTTP服务(Jetty)
我们来看下数据都有哪些指标
# curl -s http://127.0.0.1:34545/metrics | jq
{
"SINK.k1": {
"ConnectionCreatedCount": "2", //当前有效的连接数
"ConnectionClosedCount": "1", //
"Type": "SINK", //组件类型是sink
"BatchCompleteCount": "0", //成功完成输出的批量event个数
"BatchEmptyCount": "0",
"EventDrainAttemptCount": "6", //sink成功写出到存储的event总数量
"StartTime": "1517992885268", //组件启动时间
"EventDrainSuccessCount": "6",
"BatchUnderflowCount": "0", //没有达到batchsize的批量event数目
"StopTime": "0",
"ConnectionFailedCount": "0" //sink端连接失败的次数
},
"CHANNEL.c1": {
"ChannelCapacity": "10000", //channel的容量
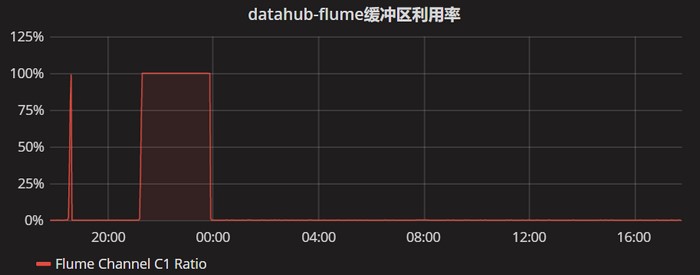
"ChannelFillPercentage": "0.0", //channel空间已使用的百分比
"Type": "CHANNEL", //组件类型是channel
"ChannelSize": "0", //目前channel中event的总数量
"EventTakeSuccessCount": "6", //sink成功读取的event的总数量
"EventTakeAttemptCount": "520", //sink尝试从channel拉取event的次数
"StartTime": "1517992885266", //组件启动时间
"EventPutAttemptCount": "6", //source尝试写入channel的次数
"EventPutSuccessCount": "6", //source成功写入channel且提交的event总数量
"StopTime": "0"
},
"SOURCE.r1": {
"KafkaEventGetTimer": "5999",
"AppendBatchAcceptedCount": "0",
"AppendReceivedCount": "0",
"EventAcceptedCount": "6",
"StartTime": "1517992886425", //组件启动时间
"AppendBatchReceivedCount": "0",
"KafkaCommitTimer": "12",
"EventReceivedCount": "6",
"Type": "SOURCE", //组件类型是source
"KafkaEmptyCount": "0",
"OpenConnectionCount": "0",
"AppendAcceptedCount": "0",
"StopTime": "0"
}
}指标太多,暂时还不能全部理解,channel中的ChannelFillPercentage需要格外注意,要是满了Flume基本上就没法工作了。
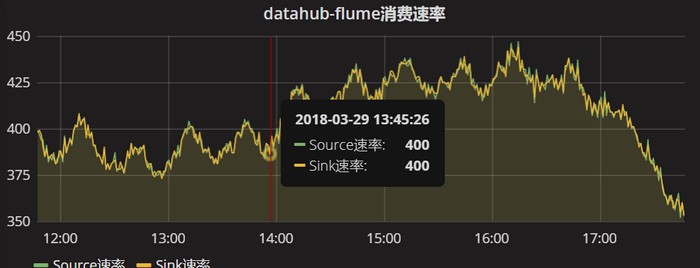
以下是Zabbix+Grafana出来的图像。
三、参考资料
http://blog.csdn.net/looklook5/article/details/40588669
http://blog.csdn.net/liuxiao723846/article/details/78135489
http://flume.cn/2016/05/18/flume%E7%9A%84http%E7%9B%91%E6%8E%A7%E5%8F%82%E6%95%B0%E8%AF%B4%E6%98%8E/
http://www.cnblogs.com/lxf20061900/p/3845356.html
转载请注明:IPCPU-网络之路 » Flume进阶之-拦截器Interceptor和监控