Grafana插件使用.md
概述
Grafana拥有丰富的图标功能,能很方便的从Prometheus、Zabbix、MySQL中读取相关的数据,对于运维人员来讲,是每日必看的站点。
但是对于一些复杂的图形,他的处理功能就比较弱了,这时我们想到了百度的echarts,有没有类似插件呢?还真被我们找到了。
官网地址是: https://github.com/Billiballa/bilibala-echarts-panel
echarts插件简单介绍
这个插件目前支持echarts 4.9 ,根据echarts的文档,我们只需要给出option, 就可以做出图形,如下,
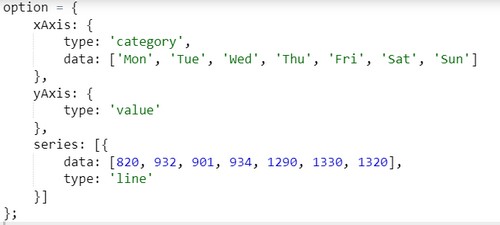
这个插件也很简单,就提供了一个Echarts Option,可以自行编写一些函数,最终return echarts中option内容就可以了。
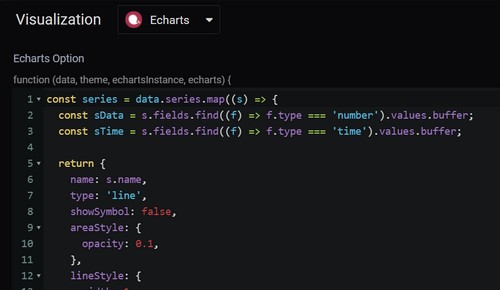
注意:官方还在Echarts Option上方提供FollowGrafanaTheme 开关,没什么用,占页面地盘,被我删掉了。
使用echarts制作大盘
经过一番了解,发现插件自带的第一个函数用于从数据源查询出来的time和value数据传递,因为我们的数据不是时序型数据,很难通过这个方法传递。
后来又发现这个插件支持ajax,可以发起ajax请求获取远程的数据,因此我们直接调用了远程数据。

最终我们做出的大盘如上图,主要用来分析阿里云OSS存储的账单,那一项花费比较多,哪个bucket花费比较多,哪个计费项花费比较多,可以一目了然。
我们的代码如下
option = {
         title: [
    {text: '本月OSS总费用',x: '2%',y: '0%',
             textStyle: {fontSize: 16, color: "#bd9f00"}},
    {text: '',x: '12%',y: '0%',
              textStyle: {fontSize: 16, color: "#ffdd29"}},
     {text: '计费项占比',x: '49%',y: '47%',
                textStyle: {fontSize: 18, color: "#fff"}},
],
    tooltip: {
        trigger: 'item',
        formatter: '{a} <br/>{b}: {c} ({d}%)'
    },
     grid: [
         {left: '2%', // 网格部分
             right: '65%',
             top: '10%',
             bottom: '2%',
             containLabel: true
         },
         {left: '75%', // 网格部分
             right: '2%',
             top: '10%',
             bottom: '45%',
             containLabel: true
         },
         {left: '75%', // 网格部分
             right: '2%',
             top: '65%',
             bottom: '0%',
             containLabel: true
         },
           ],
    xAxis: [
        {gridIndex: 0,type: 'value',axisLabel: {
                    textStyle: {
                        color: '#c9c9ca'
                    }
                },splitLine: {
              lineStyle: {
                type: "dotted"
              }
            }},
        {gridIndex: 1,type: 'value',  position: 'top', inverse:true, axisLabel: {
                    textStyle: {
                        color: '#c9c9ca'
                    }
                },splitLine: {
              lineStyle: {
                type: "dotted"
              }
            }},
        {gridIndex: 2,type: 'value',  position: 'top', inverse:true, axisLabel: {
                    textStyle: {
                        color: '#c9c9ca'
                    }
                },splitLine: {
              lineStyle: {
                type: "dotted"
              }
            }},
    ],
    yAxis: [
        {gridIndex: 0, type: 'category' ,position: 'top'},
        {gridIndex: 1, type: 'category' , inverse:true, },
        {gridIndex: 2, type: 'category' , inverse:false, },
    ],
    color: ["#87f7cf", "#f7f494", "#72ccff", "#f7c5a0", "#fc97af", "#d4a4eb", "#d2f5a6", "#76f2f2"],
    series: [
        {
            name: '费用类别',
            type: 'pie',
            center: ['54%', '50%'],
            radius: ['35%', '60%'],
            avoidLabelOverlap: true,
            color: [ "#f7f494", "#72ccff", "#f7c5a0", "#87f7cf","#fc97af", "#d4a4eb", "#d2f5a6", "#76f2f2"],
            label: {
                show: true,
                position: 'outside',
                formatter: '{a|{b}:{d}%}\n{hr|}',
                rich: {
                    hr: {
                        borderRadius: 3,
                        width: 3,
                        height: 3,
                        padding: [3, 3, 0, -12]
                    },
                    a: {
                        padding: [-30, 15, -20, 15]
                    }
                 }
            },
            labelLine: {
                normal: {
                    length: 20,
                    length2: 30,
                    lineStyle: {
                        width: 1,
                        color: '#fff'
                    }
                }
            },
            emphasis: {
                label: {
                    show: true,
                    fontSize: '30',
                    fontWeight: 'bold'
                }
            },
            labelLine: {
                show: true
            }
        },
        {
            name:'费用类别',
            type: 'bar',
            xAxisIndex: 0,
            yAxisIndex: 0,
            label: {
                normal: {
                    show: true,
                    position: 'right',
                    formatter: '{b} {c}'
                }
            }
        },
        {
            name:'费用类别',
            type: 'bar',
            color: [  "#72ccff", "#f7c5a0", "#f7f494","#87f7cf","#fc97af", "#d4a4eb", "#d2f5a6", "#76f2f2"],
            xAxisIndex: 1,
            yAxisIndex: 1,
            label: {
                normal: {
                    show: true,
                    position: 'left',
                    formatter: '{b} {c}'
                }
            }
        },
         {
            name:'费用类别',
            type: 'bar',
            color: [  "#e0cfeb", "#d2f5a6", "#76f2f2"],
            xAxisIndex: 2,
            yAxisIndex: 2,
            label: {
                normal: {
                    show: true,
                    position: 'left',
                    formatter: '{b} {c}'
                }
            }
        },
    ]
};

$.ajax({
    url: "https://json.ipcpu.com/json/ossdata.json",
  type: 'GET',
    dataType: 'json',
    error: function (request, error) {
        console.log(" Can't do because: " + error);
  },
  success: function (res) {
      if (res) {
      option.series[0].data = res.itemdata;
      option.series[1].data = res.itemdata;
      option.series[2].data = res.bucketdata.slice(0,5);
      option.series[3].data = res.detaildata.slice(0,5);
      option.title[1].text = res.totalfee;
      echartsInstance.setOption(option)
    }
}
});
代码第一部分,option用来定义了echarts图表的属性;第二部分是调用了ajax获取远程的json数据来对图表进行绘制。
总结
时序型数据(time series data) 有多个Time-Value(时间戳和值的组合)构成,Grafana、Prometheus就是专门处理这种数据的;在处理其他数据的时候就非常不友好了。
本例中我们通过ajax获取的json数据,使用echarts图形组件进行展示,仅仅是在Grafana上加了一个页面,与Grafana本身关系不大,我们实现的功能可以很容易的挪到其他HTML页面上。
转载请注明:IPCPU-网络之路 » Grafana中echarts插件使用