一、概述
本文整理了Prometheus的一些数据模型和存储机制,涉及到metric names,labels,samples,Series,Chunk、HeadChunk、Block等概念。
对于理解Prometheus运行机制,理解常见的Prometheus监控指标有一定帮助。
本文资料全部来源于其他网站,若有错误,请大家指出。
二、数据模型 DataModel
Prometheus 的监控数据以指标(metric)的形式保存在内置的时间序列数据库(TSDB)当中。
指标名称和标签(metric names, labels)
每一条时间序列由指标名称(Metrics Name)以及一组标签labels(键值KV对)唯一标识。
TIPS: 改变标签中的K或者V值(包括添加或删除),都会创建新的时间序列。
样本Samples
在时间序列中的每一个点称为一个样本(sample),样本由以下三部分组成:
指标(metric):指标名称Metric names和标签labels;
时间戳(timestamp):一个精确到毫秒的时间戳;
样本值(value): 一个 folat64 的浮点型数据表示当前样本的值。
如下就是三个样本数据,很好的解释了这几个名词的分布
<-------------------- metric ------------------><-----timestamp-----><--value-->
<--- metric name---><--------labels------------><-----timestamp-----><--value-->
http_request_total{status="200", method="GET"}@1434417560938 => 94355
http_request_total{status="200", method="GET"}@1434417561287 => 94334
http_request_total{status="200", method="POST"}@1434417561287 => 93656
当我们根据时间顺序,把样本数据统一放在一起,就可以形成一条监控曲线,如下
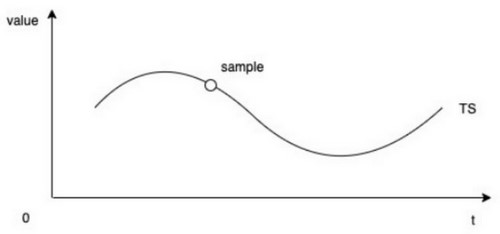
这样的特定的metric、timestamp、value构成的时间序列(TimeSeries) 在Prometheus中被称作Series。
所以我们总结以上几个概念:
Metric names 指标名称
labels 指标标签,与指标名称一同构成唯一标识项
Samples 一个时间点的 Metric names,labels,样本值(value),
Series 由很多相关的samples组成的时间序列
TIPS:时间序列 (Time Series) 指的是某个指标随时间变化的所有历史数据,而样本 (Sample) 指的是历史数据中该变量的瞬时值。
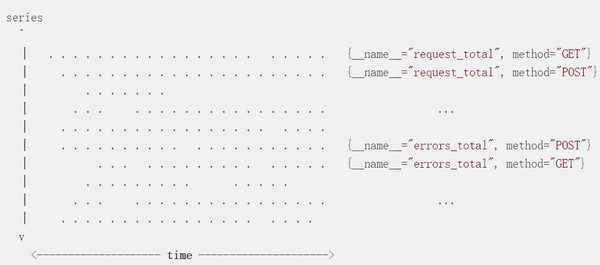
当我们有很多的Series,就可以用下面的示意图表示了,图上每一个点都是一个Sample。
三、Prometheus中Samples和Series的监控
理解了Samples和Series,我们来看下Prometheus自身的监控数据
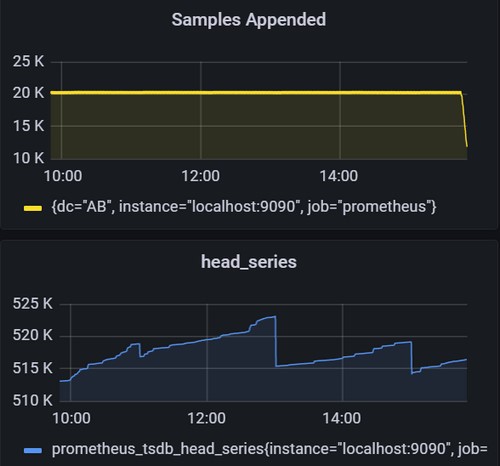
rate(prometheus_tsdb_head_samples_appended_total{instance="localhost:9090"}[5m])Prometheus每秒钟收到的Samples数量,此值的大小反映了Prometheus的当前的繁忙程度,类似于zabbix中的new value per second ,当此值超过10万,可以考虑进行分片拆分以减轻压力。
prometheus_tsdb_head_series{instance="localhost:9090",job="prometheus"}Prometheus内存中最新的一次的series数量,此值反应的Prometheus当前收到的监控对象Series(也可以直接理解为时间序列)数量。
这里我们给出查询所有时间序列的方法:
#查询所有时间序列Series
{__name__=~".+"}
#统计所有时间序列Series的数量
count({__name__=~".+"})
四、Prometheus的的存储机制
4.1 存储概览
Prometheus将最近的数据保存在内存中,这样查询最近的数据会变得非常快,然后通过一个compactor定时将数据打包到磁盘。数据在内存中最少保留2个小时(storage.tsdb.min-block-duration。至于为什么设置2小时这个值,是Gorilla那篇论文中观察得出的结论,即压缩率在2小时时候达到最大值。
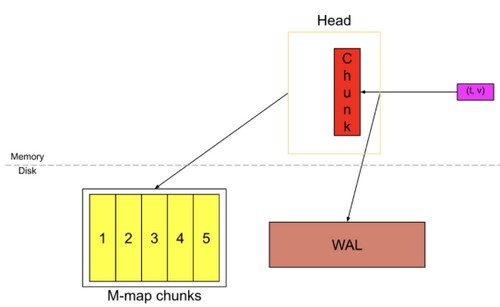
为了防止程序崩溃导致数据丢失,实现了WAL(write-ahead-log)机制,启动时会以写入日志(WAL)的方式来实现重播,从而恢复数据。
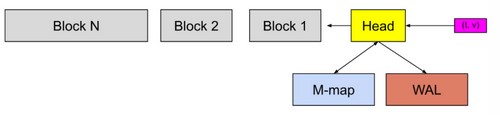
在上图中,HeadBlock是数据库的内存部分,灰色块是存在磁盘上的不可更改的持久块Block。 我们有一个预写日志(WAL)用于持久写入。 传入的样本(粉红色方框)首先进入HeadBlock并在内存中停留一会儿,然后刷新到磁盘并映射到内存(蓝色的方框)。当这些内存映射 chunks 或内存中的 chunks 变旧到一定程度时,它们将作为持久块Block刷新到磁盘。
4.2 数据块chunk
读到这里,大家肯定会有一个疑惑?Block还可以理解,每两个小时数据切一个块,就是一个Block,chunk这个概念是哪里来的?
在Prometheus内部,chunk是用来存储压缩后的样本sample数据的最小单位。chunk的大小1KB,每个chunk可以存储最多120个样本,当chunk存满120个样本或超过了chunkRange的时间范围(默认情况为 2h),就会写到新的chunk里。
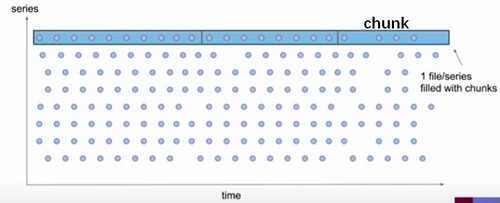
如上图,每一个Series的样本数据,由多个chunk来进行存储,按照上面所说的存满120个或者超过chunkRange时间,就会写到新的里面。
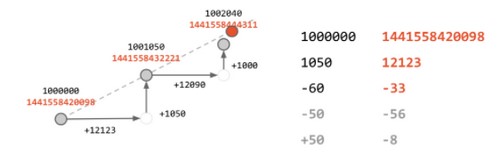
chunk存储的是经过压缩后的sample数据,压缩的方法类似于下面图片展示的,使用数据变化来存储,经过压缩以后每个sample大约占用1.3-1.8字节大小。
这里还有一个知识点要说下,chunk写满以后,Prometheus会存入到磁盘,并使用MMAP做映射关系,来节省内存的消耗。如下。
4.3 磁盘存储结构
Prometheus磁盘存储结构如下图所示,
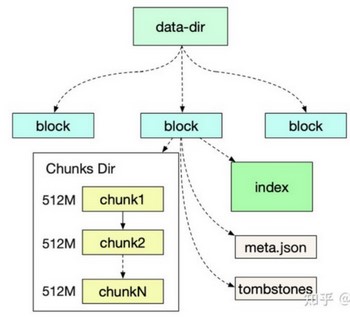
在磁盘中每一个块(Block)又分为
chunk存储目录,里面的chunk文件(chunk文件最大512M)存储了具体的监控数据
index 索引用于快速查找监控指标对应的监控值,
元数据文件(meta.json)标识了一些基本信息,
tombstones 标识了一些删除文件。
我们看一个meta.json信息
{
    "ulid": "01FDG3DA4W3X7A107X4TQ5NM27",
    "minTime": 1629396000000,
    "maxTime": 1629403200000,
    "stats": {
        "numSamples": 145786877,
        "numSeries": 516895,
        "numChunks": 1218908
    },
    "compaction": {
        "level": 1,
        "sources": [
            "01FDG3DA4W3X7A107X4TQ5NM27"
        ]
    },
    "version": 1
}
Prometheus默认会对旧的Block数据进行合并和压缩,以减少文件的数量,但是官方仍然不建议存储过长时间的数据。我们曾经在生产环境中存储了3T左右的大约1年的监控数据,并没有发现什么问题,但是重启prometheus实例加载历史数据(并非WAL数据)需要将近30-50分钟,让我们无法接受,最后我们还是投入了Thanos的怀抱,将监控数据存在阿里云OSS对象存储中。
五、Prometheus中Chunk和Block的监控
# HELP prometheus_tsdb_blocks_loaded Number of currently loaded data blocks
# TYPE prometheus_tsdb_blocks_loaded gauge
prometheus_tsdb_blocks_loaded 85
#被Prometheus管理的Block数量,网上有解释成加载到内存中的块数量,是错误的,只有HeadBlock在内存中。
# HELP prometheus_tsdb_storage_blocks_bytes The number of bytes that are currently used for local storage by all blocks.
# TYPE prometheus_tsdb_storage_blocks_bytes gauge
prometheus_tsdb_storage_blocks_bytes 2.9467243543e+10
#所有Block占用的磁盘空间,由于WAL较小,此值可以等价于Prometheus磁盘使用空间
# HELP prometheus_tsdb_head_chunks Total number of chunks in the head block.
# TYPE prometheus_tsdb_head_chunks gauge
prometheus_tsdb_head_chunks 1.128714e+06
#内存中chunk数量
六、Prometheus容量规划
6.1 磁盘容量规划
通过对Prometheus使用磁盘目录的分析,我们发现,每个Block占用磁盘空间主要有三部分:
Chunk数据 ,241M
index数据,87M
WAL数据,3913M
由于Prometheus每2小时生成一个Block,我们先计算下每个Block大小,每个Block有主要由Chunk数据,index数据构成,我们根据以前历史数据,得出index数据量比chunk总数据量比例是 35:100。
然后我们查询Prometheus得出,2小时内新增sample数量,我得到结果是145394292。
increase(prometheus_tsdb_head_samples_appended_total[2h])sample平均大小, 得到结果约为1.8 Bytes
  rate(prometheus_tsdb_compaction_chunk_size_bytes_sum[1d])
/
  rate(prometheus_tsdb_compaction_chunk_samples_sum[1d])
chunk数据占用存储空间=两小时内新增sample数量 * 每个sample平均大小 = 145394292 * 1.8 = 261M
index数据存储空间 = chunk数据占用存储空间* 35% = 91M
总磁盘占用量= (chunk数据占用存储空间 + index数据存储空间)*Block数量 + WAL磁盘存储空间(历史数据)
6.2 内存容量规划
https://www.jianshu.com/p/93412a925da2
尽管我们有一些工具可以测算出内存占用情况,例如
https://www.robustperception.io/how-much-ram-does-prometheus-2-x-need-for-cardinality-and-ingestion
但是,实际情况是我们仅能够测算出
go tool pprof -symbolize=remote -inuse_space http://172.28.9.46:9090/debug/pprof/heap参考资料
(前3个是官方作者文章)
https://prometheus.io/docs/concepts/data_model/
https://ganeshvernekar.com/blog/prometheus-tsdb-the-head-block
https://www.youtube.com/watch?v=b_pEevMAC3I
https://yunlzheng.gitbook.io/prometheus-book/parti-prometheus-ji-chu/promql/what-is-prometheus-metrics-and-labels
https://zhuanlan.zhihu.com/p/353670507
https://www.cnblogs.com/vovlie/p/7709312.html
转载请注明:IPCPU-网络之路 » prometheus数据模型和存储机制